Breastfeeding Statistics 2026
102 verified breastfeeding statistics on US and global rates, gaps, hospitals, work, donor milk, health impact and mental health, each linked to its source.
Last verified: 2026-10-12. Next review: 2027-01-12.
This page brings together 102 breastfeeding statistics on US and global breastfeeding rates, gaps between groups, hospital practices, work and paid leave, why parents stop, health and economic impact, donor milk and formula, and maternal mental health. Every figure links to the primary source it comes from and was checked against that page; the data was last verified on October 12, 2026.
Key takeaways
- 86.1% of US babies born in 2023 were ever breastfed, but only 40.8% were still breastfed at 12 months (CDC).
- Only 29.8% of US infants born in 2023 were exclusively breastfed through 6 months, against a Healthy People 2030 target of 42.4%.
- In 2024, 76.5% of infants born to Black mothers were breastfed before hospital discharge, compared with 89.9% of Asian infants (America’s Health Rankings).
- Worldwide, about 47% of infants under 6 months are exclusively breastfed; WHO’s target is at least 60% by 2030.
- In England’s 2024 Infant Feeding Survey, 72% of mothers who stopped by 4 to 6 months would have liked to breastfeed for longer.
- Nonprofit North American milk banks dispensed a record 13 million ounces of donor milk in 2025, 12% more than in 2024 (HMBANA).
- About 1 in 8 US women with a recent live birth (11.9%) reported postpartum depressive symptoms in 2023.
Contents
- US breastfeeding rates today
- Exclusive breastfeeding and early formula
- Gaps by race, education, age and place
- Trends over time
- Breastfeeding around the world
- Hospitals and support at birth
- Work, pumping and leave
- Why parents stop and common problems
- Health and economic impact
- Donor milk, formula and milk sharing
- Mental health after birth
US breastfeeding rates today
Most US babies start out breastfed, but fewer than two in three are still breastfed at 6 months and about four in ten at 1 year.
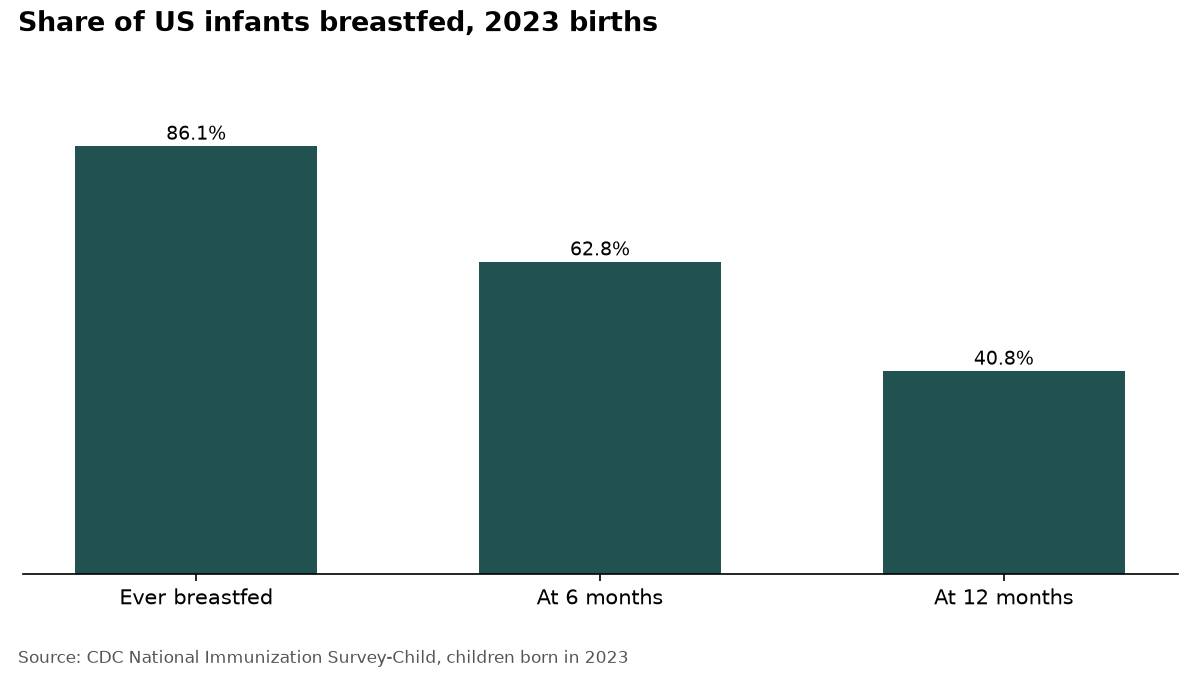 Breastfeeding drops from 86.1% ever breastfed to 40.8% at 12 months (CDC NIS-Child, 2023 births).
- Among US infants born in 2023, 86.1% were ever breastfed, according to CDC’s National Immunization Survey-Child. (Source: CDC, National Immunization Survey-Child, Results: Breastfeeding Rates (2023 births))
- 62.8% of US infants born in 2023 were still receiving any breast milk at 6 months of age. (Source: CDC, National Immunization Survey-Child, Results: Breastfeeding Rates (2023 births))
- 40.8% of US infants born in 2023 were still breastfed at 12 months, the same rate CDC reported for 2022 births. (Source: CDC, National Immunization Survey-Child, Results: Breastfeeding Rates (2023 births))
- Ever-breastfed rates for US babies born in 2023 ranged from 94.4% in Hawaii, the highest of any state, to 73.5% in Alabama, the lowest. (Source: CDC, Rates of Any and Exclusive Breastfeeding by State among Children Born in 2023)
- Healthy People 2030 aims for 42.4% of US infants to be exclusively breastfed through 6 months; the most recent value it reports is 27.9% for 2022 births, up from a 24.9% baseline for 2015 births. (Source: Healthy People 2030 (ODPHP), objective MICH-15, 2022)
- Healthy People 2030 sets a target of 54.1% of US infants breastfed to any extent at 1 year; the latest reported value is 40.8% for 2022 births, against a 35.9% baseline for 2015 births. (Source: Healthy People 2030 (ODPHP), objective MICH-16, 2022)
- In 2022, 70.0% of infants enrolled in WIC were breastfed after birth, according to USDA’s WIC participant characteristics report. (Source: USDA Food and Nutrition Service, WIC Participant and Program Characteristics 2022)
- Among infants in WIC in 2022, 22.5% were breastfed at 6 months and 15.4% at 12 months, USDA reports. (Source: USDA Food and Nutrition Service, WIC Participant and Program Characteristics 2022)
- In the fourth quarter of fiscal year 2024, 245,604 infants in WIC were fully breastfed and 400,101 were partially breastfed, while 857,225 were fully formula-fed. (Source: USDA Economic Research Service, Charts of Note: Breastfeeding in WIC program continued to increase in fiscal year 2024 (April 2025))
- Texas reported a 61.7% breastfeeding rate among WIC infants in fiscal year 2023, the third-highest of any WIC state agency, behind the Virgin Islands (70.7%) and American Samoa (62.0%). (Source: USDA Food and Nutrition Service, Fiscal Year 2023 WIC Breastfeeding Data Local Agency Report (published October 2024))
Exclusive breastfeeding and early formula
Fewer than half of US babies get only breast milk through 3 months and fewer than a third through 6 months, and more than one in five breastfed babies gets formula in the first two days.
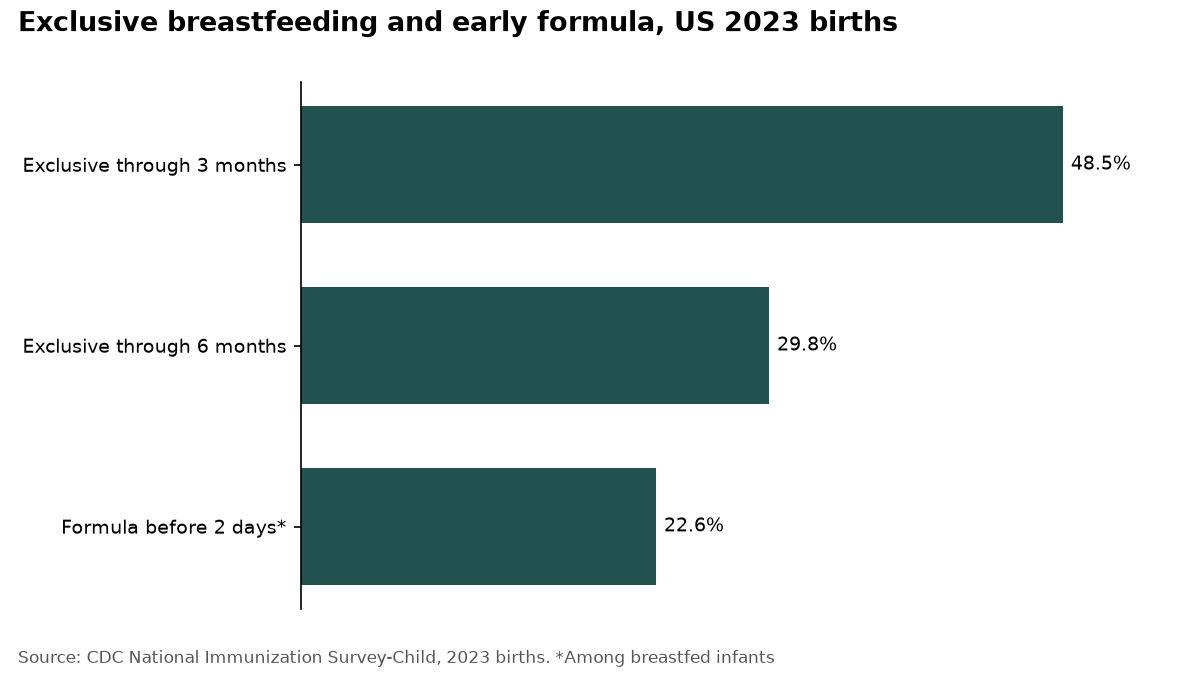 Exclusive breastfeeding falls from 48.5% at 3 months to 29.8% at 6 months (CDC NIS-Child, 2023 births).
- 48.5% of US infants born in 2023 were exclusively breastfed through 3 months of age. (Source: CDC, National Immunization Survey-Child, Results: Breastfeeding Rates (2023 births))
- Only 29.8% of US infants born in 2023 were exclusively breastfed through 6 months, meaning they received only breast milk with no solids, water or other liquids. (Source: CDC, National Immunization Survey-Child, Results: Breastfeeding Rates (2023 births))
- 22.6% of breastfed US infants born in 2023 were given infant formula before they were 2 days old. (Source: CDC, National Immunization Survey-Child, Results: Breastfeeding Rates (2023 births))
- Among infants born in 2022, exclusive breastfeeding for six months ranged from 36.7% in Nebraska, the top-ranked state, to 19.5% in Georgia, the lowest-ranked, against a US value of 27.9%. (Source: America’s Health Rankings (United Health Foundation), measure ‘Breastfed’, using CDC NIS-Child 2022 birth cohort)
- Between fiscal years 2014 and 2023, breastfed infants in WIC averaged 36.8% fully breastfed and 63.2% partially breastfed, meaning most breastfed WIC babies also received WIC formula. (Source: USDA Food and Nutrition Service, Fiscal Year 2023 WIC Breastfeeding Data Local Agency Report (published October 2024))
- Vermont’s WIC program had the second-highest fully breastfed rate of all WIC state agencies in fiscal year 2023, at 34.6% of infants, after the Pueblo of Zuni tribal WIC agency (49.4%). (Source: USDA Food and Nutrition Service, Fiscal Year 2023 WIC Breastfeeding Data Local Agency Report (published October 2024))
- In 2024, 18% of infants in Wisconsin’s WIC program were fully breastfed and 65% were fully formula-fed, compared with 13% and 77% in 2018. (Source: Wisconsin Department of Health Services, WIC Infant Breastfeeding and Fully Formula Fed Rates (2018-2024))
Gaps by race, education, age and place
Most US babies start out breastfed, but Black and American Indian/Alaska Native infants, babies of mothers under 20 or with less education, and babies in parts of the South are breastfed far less often.
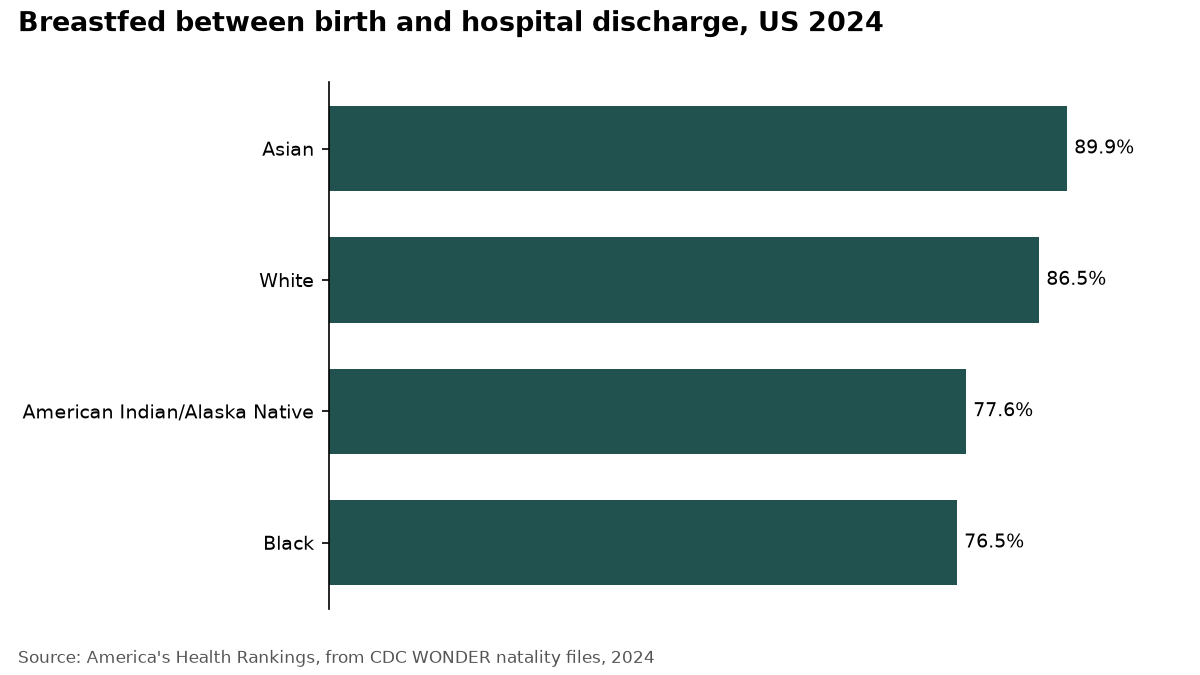 More than 13 points separate the highest and lowest groups (America’s Health Rankings, 2024 natality data).
- In 2024, 76.5% of US infants born to Black mothers were breastfed between birth and hospital discharge, compared with 86.5% of infants born to white mothers. (Source: America’s Health Rankings (United Health Foundation), Breastfeeding Initiation: Black; data: CDC NCHS natality files via CDC WONDER, 2024)
- Asian infants had the highest breastfeeding initiation of any racial group in the US in 2024, with 89.9% breastfed between birth and hospital discharge. (Source: America’s Health Rankings (United Health Foundation), Breastfeeding Initiation: Asian; data: CDC NCHS natality files via CDC WONDER, 2024)
- In 2024, 77.6% of American Indian/Alaska Native infants in the US were breastfed between birth and hospital discharge, well below the all-infant rate of 85.4%. (Source: America’s Health Rankings (United Health Foundation), Breastfeeding Initiation: American Indian/Alaska Native; data: CDC NCHS natality files via CDC WONDER, 2024)
- Breastfeeding initiation among Black infants varied widely by state in 2024, from 93.1% in Idaho to 48.1% in Arkansas. (Source: America’s Health Rankings (United Health Foundation), Breastfeeding Initiation: Black, state table; data: CDC WONDER natality, 2024)
- Across US states in 2024, the share of infants breastfed between birth and hospital discharge ranged from 94.0% in Oregon to 68.3% in Mississippi. (Source: America’s Health Rankings (United Health Foundation), Breastfeeding Initiation; data: CDC NCHS natality files via CDC WONDER, 2024)
- Among US children born in 2023, 74.2% of those whose mothers had not finished high school were ever breastfed, versus 92.2% of those whose mothers were college graduates. (Source: CDC, National Immunization Survey-Child, Rates of Any and Exclusive Breastfeeding by Socio-demographics (children born in 2023))
- Among US children born in 2023, 82.4% of those living outside metropolitan areas were ever breastfed, compared with 86.6% of those in metropolitan areas. (Source: CDC, National Immunization Survey-Child, Rates of Any and Exclusive Breastfeeding by Socio-demographics (children born in 2023))
- Breastfeeding initiation varied from 22% to more than 90% across US counties for babies born in 2018 and 2019, with lower rates concentrated in Appalachia and along the Gulf Coast. (Source: Grubesic T, et al. Spatial inequalities in breastfeeding initiation in the United States: a multiscale analysis of county-level determinants. PLOS Global Public Health, 2026, 2019)
- In 2016–2019 PRAMS data from 43 states and DC, only 25.5% of mothers under 20 were still breastfeeding at 6 months or at the time of the survey, among the lowest rates of any group. (Source: Diaz LE, Yee LM, Feinglass J. Rates of breastfeeding initiation and duration in the United States: data insights from the 2016-2019 PRAMS. Frontiers in Public Health, 2023;11:1256432)
- In 2016–2019 PRAMS data from 43 states and DC, 36.3% of non-Hispanic Black mothers were breastfeeding at 6 months or at the time of the survey, one of the lowest six-month rates of any group. (Source: Diaz LE, Yee LM, Feinglass J. Rates of breastfeeding initiation and duration in the United States: data insights from the 2016-2019 PRAMS. Frontiers in Public Health, 2023;11:1256432)
Trends over time
US breastfeeding has risen slowly but steadily for more than a decade, with an extra jump after the 2022 infant formula shortage, especially among WIC families.
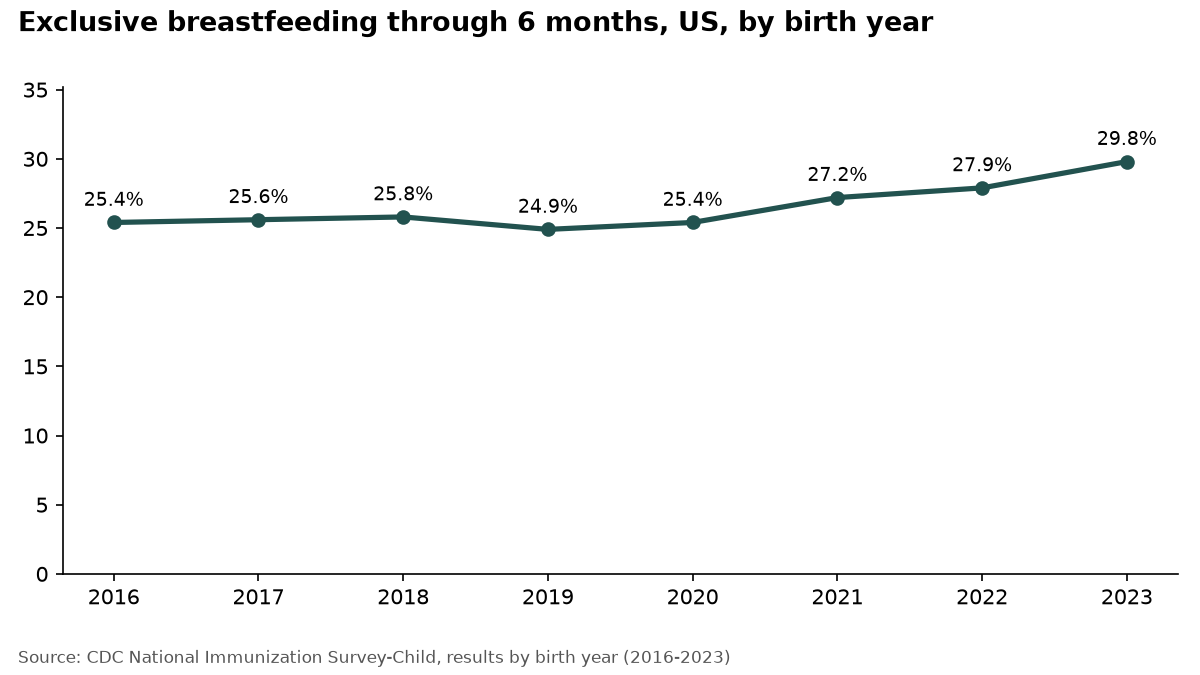 Exclusive breastfeeding through 6 months reached 29.8% for 2023 births, up from 25.4% in 2016 (CDC NIS-Child).
- Among 167,842 US infants born between 2009 and 2015, overall breastfeeding initiation rose by 7.1 percentage points and breastfeeding at 12 months by 11.3 percentage points. (Source: Li R et al., ‘Breastfeeding Trends by Race/Ethnicity Among US Children Born From 2009 to 2015’, JAMA Pediatrics, 2019)
- Exclusive breastfeeding through 6 months rose by 9.2 percentage points among US infants born from 2009 to 2015, based on National Immunization Survey-Child data. (Source: Li R et al., ‘Breastfeeding Trends by Race/Ethnicity Among US Children Born From 2009 to 2015’, JAMA Pediatrics, 2019)
- Exclusive breastfeeding through 6 months among US infants climbed from 25.4% for 2016 births to 29.8% for 2023 births. (Source: CDC, National Immunization Survey-Child, Results: Breastfeeding Rates (2016-2023 births))
- Breastfeeding initiation among 6- to 13-month-old infants and children in WIC rose after 2004, peaked at 72% in 2018 and stood at 70% in 2022. (Source: USDA Food and Nutrition Service, WIC Participant and Program Characteristics 2022)
- From fiscal year 2014 to 2023, the share of WIC infants who were breastfed showed a national increase of 7.8%, which USDA describes as a 26.4% growth rate over the period. (Source: USDA Food and Nutrition Service, Fiscal Year 2023 WIC Breastfeeding Data Local Agency Report (published October 2024))
- After the 2022 US infant formula shortage began, breastfeeding initiation saw a peak increase of 3.20 percentage points in June 2022 (87.18% vs 83.98%), according to a Pediatrics study of 2016-2022 birth certificates from 47 states and DC. (Source: American Academy of Pediatrics news release on Seoane Estruel L, Andreyeva T, ‘Breastfeeding Trends Following the US Infant Formula Shortage’, Pediatrics, January 2025, 2022)
- In the fourth quarter of fiscal year 2024 the number of fully breastfed infants in WIC was 45 percent higher than in the first quarter of fiscal year 2022, while fully formula-fed infants fell 6 percent. (Source: USDA Economic Research Service, Charts of Note: Breastfeeding in WIC program continued to increase in fiscal year 2024 (April 2025))
- The share of Wisconsin WIC infants receiving any breast milk rose from 23% in 2018 to 35% in 2024. (Source: Wisconsin Department of Health Services, WIC Infant Breastfeeding and Fully Formula Fed Rates (2018-2024))
Breastfeeding around the world
Worldwide, fewer than half of babies under 6 months are exclusively breastfed, and while rates are rising, the world is still short of the WHO target of 60% by 2030, with wide gaps between countries.
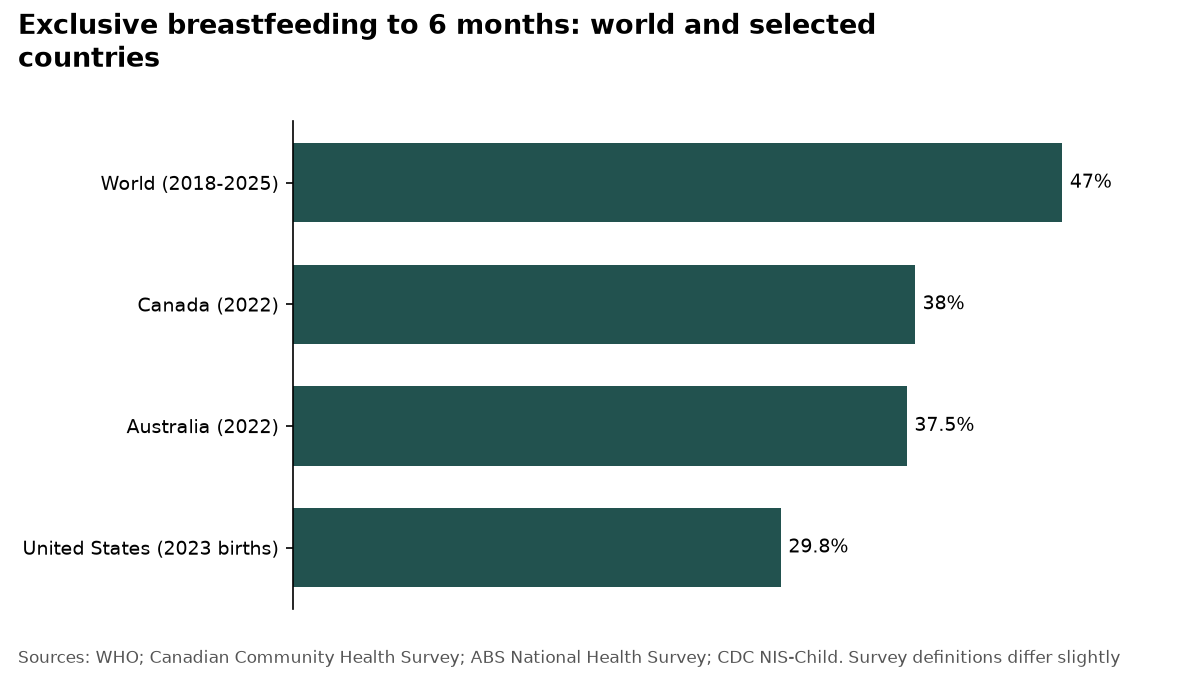 The US exclusive breastfeeding rate is below the global average (WHO, PHAC, ABS, CDC). Survey definitions differ.
- Worldwide, only about 47% of infants aged 0–6 months were exclusively breastfed, according to WHO data covering 2018–2025. (Source: World Health Organization, Infant and young child feeding fact sheet, 2025)
- The global share of infants exclusively breastfed in their first six months rose from around 37 per cent in 2012 to over 47 per cent, according to a July 2026 joint WHO and UNICEF statement. (Source: WHO/UNICEF joint statement for World Breastfeeding Week, 31 July 2026, 2025)
- Over the past five years, the global share of children still breastfed at two years of age rose from 38 per cent to 50 per cent, WHO and UNICEF reported in July 2026. (Source: WHO/UNICEF joint statement for World Breastfeeding Week, 31 July 2026, 2025)
- WHO member states have set a global goal of raising exclusive breastfeeding in the first 6 months of life to at least 60% by 2030, compared with about 47% today. (Source: World Health Organization, Infant and young child feeding fact sheet, 2030)
- In England, 55.6% of infants were being breastfed at their 6 to 8 week check in the 2024 to 2025 financial year, up from 52.7% the year before and the highest since the data series began in 2015 to 2016. (Source: Office for Health Improvement and Disparities (GOV.UK), Breastfeeding at 6 to 8 weeks 2024 to 2025: statistical commentary)
- In England’s 2024 national Infant Feeding Survey of mothers who gave birth in August and December 2023, 86% of mothers initiated breastfeeding. (Source: Office for Health Improvement and Disparities (GOV.UK), Infant feeding survey 2024: summary of main findings, 2023)
- In Scotland, 51% of babies were receiving some breast milk at the 6-8 week health visitor review in 2024/25 (34% exclusively and 17% mixed fed), the first time since records began in 2002/03 that more babies were breastfed than formula fed only. (Source: Public Health Scotland, Infant feeding statistics, financial year 2024 to 2025)
- In Canada, 38% of parents breastfed exclusively for at least 6 months according to the 2022 Canadian Community Health Survey, up from 35% in 2017-2018. (Source: Public Health Agency of Canada, Canada’s breastfeeding dashboard (2024 edition), Canadian Community Health Survey data, 2022)
- In Australia, 37.5% of children aged 0–3 years in the 2022 National Health Survey had been exclusively breastfed to 6 months, up from 29.1% in 2017–18. (Source: Australian Bureau of Statistics, Breastfeeding, 2022 (National Health Survey))
- In Sweden, 65 percent of babies were still breastfed (fully or partly) at six months of age in 2021, compared with just over 93 percent at one week, according to the National Board of Health and Welfare. (Source: Socialstyrelsen (Swedish National Board of Health and Welfare), Statistik om amning, 2021)
- In Bangladesh, the share of newborns breastfed within one hour of birth fell from 46.6 per cent in 2019 to 30.4 per cent in 2025, according to the Multiple Indicator Cluster Survey (MICS) 2025. (Source: UNICEF Bangladesh and WHO, press release on World Breastfeeding Week 2026 (Bangladesh MICS 2025))
Hospitals and support at birth
US hospitals score 82 out of 100 on CDC’s maternity-care survey, but only about a quarter limit formula for breastfed newborns, and just over 400 US hospitals hold Baby-Friendly designation.
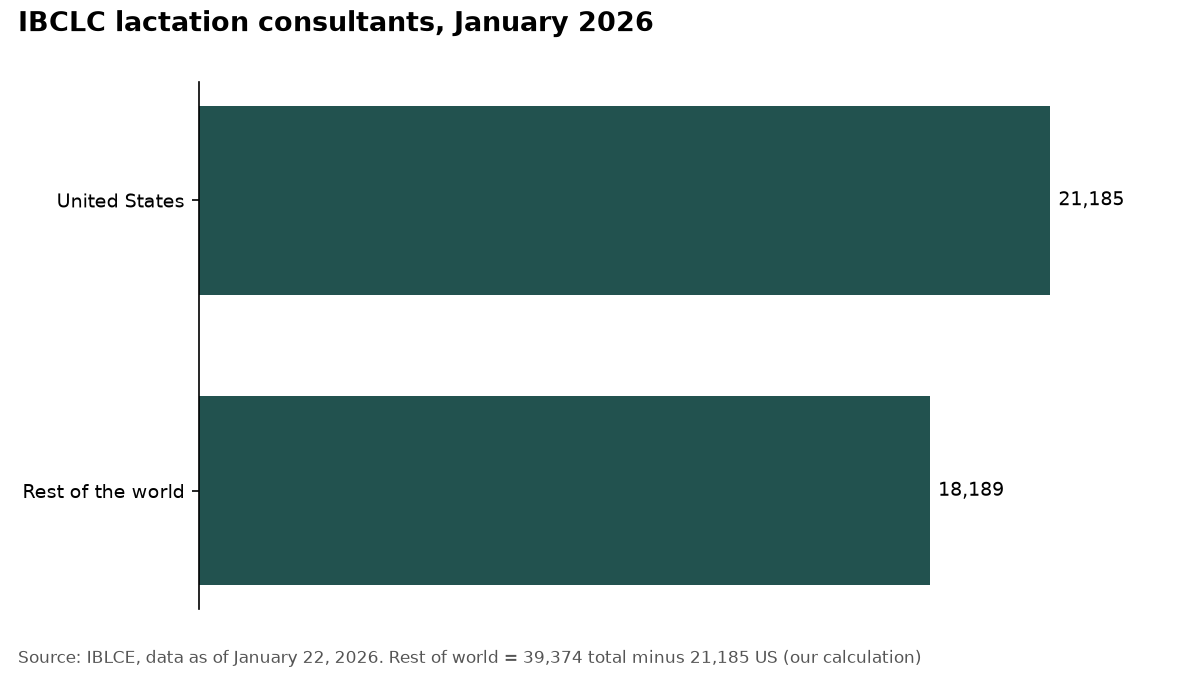 More than half of the world’s 39,374 IBCLCs are in the United States (IBLCE, January 2026).
- US hospitals earned a national total score of 82 out of 100 on CDC’s 2024 mPINC survey of maternity care practices, which reflects 2023 hospital data from 2,070 participating hospitals. (Source: CDC, Maternity Practices in Infant Nutrition and Care (mPINC) 2024 national results, 2023)
- Only 27% of US hospitals gave the ideal response that few breastfeeding newborns receive infant formula during their stay, according to CDC’s 2024 mPINC survey (2023 hospital data). (Source: CDC, mPINC 2024 national results, feeding practices, 2023)
- More than 400 hospitals in the United States hold Baby-Friendly designation, spread across all 50 states, the District of Columbia and Puerto Rico, according to Baby-Friendly USA in 2026. (Source: Baby-Friendly USA, About the Baby-Friendly Hospital Initiative, 2026)
- Worldwide, more than 20,000 maternity facilities in 150 countries have earned Baby-Friendly designation, Baby-Friendly USA reports. (Source: Baby-Friendly USA, About the Baby-Friendly Hospital Initiative, 2026)
- In 2018, more than 25% of US births took place in over 500 Baby-Friendly designated facilities, up from less than 3% of births in about 60 facilities in 2007, according to Baby-Friendly USA. (Source: Baby-Friendly USA, Find a Baby-Friendly hospital or birthing center, 2018)
- The United States had 21,185 International Board Certified Lactation Consultants (IBCLCs) as of January 22, 2026, according to IBLCE. (Source: IBLCE, Current Statistics on Worldwide IBCLCs (data as of January 22, 2026))
- There were 39,374 IBCLC-certified lactation consultants worldwide as of January 22, 2026, IBLCE reports. (Source: IBLCE, Current Statistics on Worldwide IBCLCs (data as of January 22, 2026))
- The US holds 53.8% of the world’s IBCLCs as of January 2026 (21,185 of 39,374, our calculation from IBLCE data). (Source: IBLCE, Current Statistics on Worldwide IBCLCs (data as of January 22, 2026))
Work, pumping and leave
Most mothers of infants are in the labor force, yet only about half of private-sector workers can take paid family and medical leave, and federal pumping protections last just one year after birth.
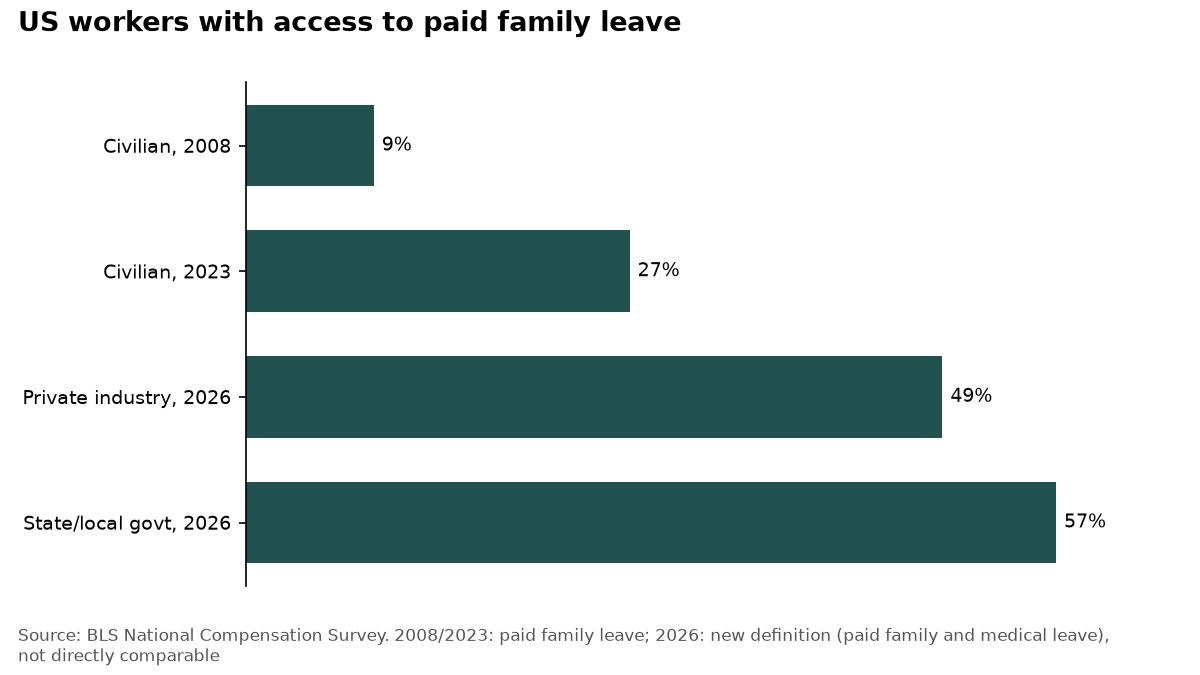 Access to paid leave has grown, but BLS changed its definition in 2026, so the bars are not directly comparable (BLS NCS).
- In March 2026, 49% of US private industry workers had access to paid family and medical leave, according to the BLS National Compensation Survey. (Source: US Bureau of Labor Statistics, Employee Benefits in the United States, March 2026 (news release, September 25, 2026))
- Among US state and local government workers, 57% had access to paid family and medical leave in March 2026, BLS reports. (Source: US Bureau of Labor Statistics, Employee Benefits in the United States, March 2026 (news release, September 25, 2026))
- Under the older BLS definition, 27% of US civilian workers had access to paid family leave in March 2023, up from 9% in March 2008, while 90% had access to unpaid family leave. (Source: US Bureau of Labor Statistics, Family leave benefits fact sheet, 2023)
- In 2025, 61.9% of US mothers whose youngest child was under 1 year old were in the labor force, according to BLS. (Source: US Bureau of Labor Statistics, Employment Characteristics of Families, Table 6 (2025 annual averages))
- Paid parental leave was offered by 46% of US employers in 2026, up seven percentage points from 2025, according to SHRM’s survey of 5,472 organizations. (Source: SHRM, 2026 Employee Benefits Survey (news article, June 17, 2026))
- Paid maternity leave beyond what the law requires was offered by 44% of US employers in 2026, up six percentage points in a year, SHRM found. (Source: SHRM, 2026 Employee Benefits Survey (news article, June 17, 2026))
- Onsite lactation rooms were offered by 67% of US employers in SHRM’s 2026 Employee Benefits Survey, a drop of 5 percentage points from the year before. (Source: SHRM, 2026 Employee Benefits Survey, Executive Summary (PDF))
- As of June 2026, 14 states and the District of Columbia had enacted mandatory paid family leave programs, and 9 more states had voluntary systems run through private insurance, according to SHRM. (Source: SHRM, ‘Paid parental leave increases’ (June 17, 2026))
- Under the federal PUMP Act, US employees covered by the FLSA have the right to reasonable break time and a private space to pump breast milk for up to one year after the child’s birth. (Source: US Department of Labor, Wage and Hour Division, Fact Sheet #73 (revised December 2025))
- US employers with fewer than 50 employees are not subject to the PUMP Act’s break time and space requirements if compliance would cause undue hardship, according to the Department of Labor. (Source: US Department of Labor, Wage and Hour Division, Fact Sheet #73 (revised December 2025))
- Among US first-time mothers whose child was born between 2014 and 2022, 49.1% took paid leave, according to the Census Bureau’s 2022 Survey of Income and Program Participation. (Source: US Census Bureau, America Counts: ‘Share of Women Who Worked Before Their First Birth Rose’ (May 13, 2025), SIPP 2022)
- About 14% of US first-time mothers quit or were let go from their job around the birth of their first child, a share that has not changed significantly across birth cohorts, Census Bureau SIPP 2022 data show. (Source: US Census Bureau, America Counts: ‘Share of Women Who Worked Before Their First Birth Rose’ (May 13, 2025), SIPP 2022)
Why parents stop and common problems
Most mothers who stop breastfeeding early would have liked to continue, and latch problems, worries about milk supply and pain are the reasons they give most often.
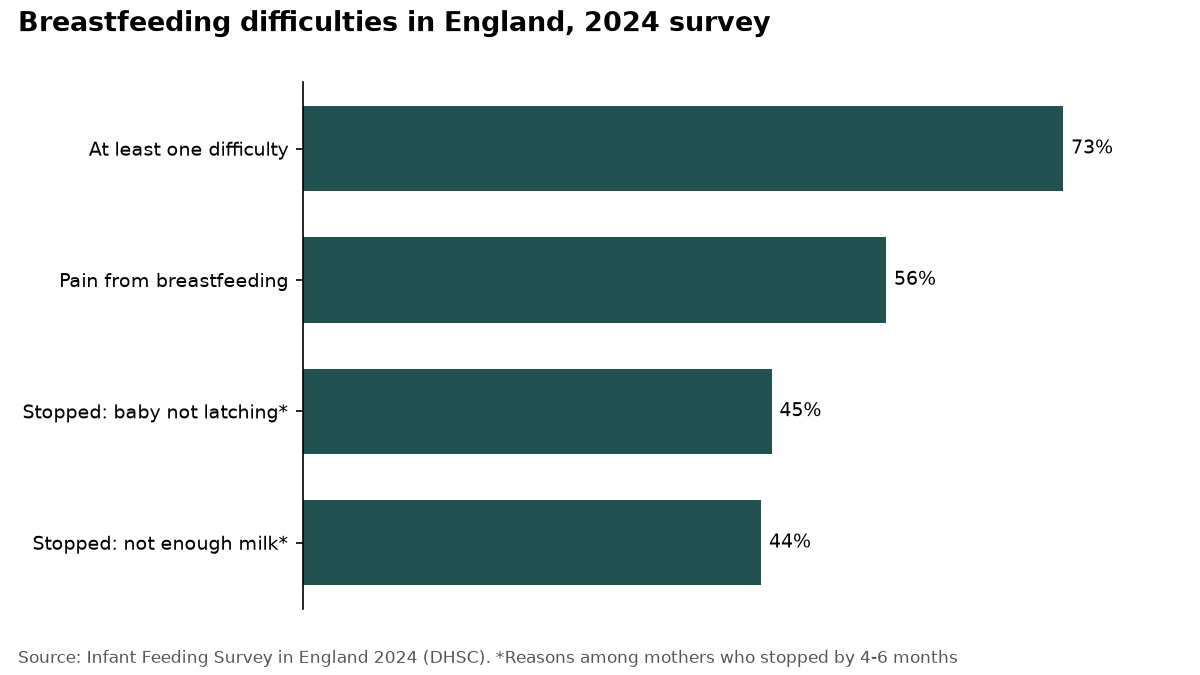 Most mothers in England meet at least one breastfeeding difficulty (Infant Feeding Survey 2024).
- In England’s 2024 Infant Feeding Survey, 72% of mothers who had stopped breastfeeding by the time their baby was 4 to 6 months old said they would have liked to breastfeed for longer. (Source: Office for Health Improvement and Disparities, Infant Feeding Survey in England 2024: summary of main findings)
- Among mothers in England who had stopped breastfeeding by 4 to 6 months in 2024, 45% gave the baby not latching on or rejecting the breast as a reason, and 44% said they felt they did not have enough milk. (Source: Office for Health Improvement and Disparities, Infant Feeding Survey in England 2024: summary of main findings)
- 73% of mothers in England who had ever breastfed reported at least one breastfeeding difficulty in the 2024 Infant Feeding Survey, with engorgement (42%) the most common. (Source: Office for Health Improvement and Disparities, Infant Feeding Survey in England 2024: summary of main findings)
- 56% of mothers in England who had ever fed breast milk to their baby in the 2024 Infant Feeding Survey reported pain from breastfeeding, such as sore nipples or painful breasts. (Source: Office for Health Improvement and Disparities, Infant Feeding Survey in England 2024: summary of main findings)
- Among mothers in England who wanted to breastfeed for longer, 53% said help with getting the baby to latch on better would have helped them continue (2024 Infant Feeding Survey). (Source: Office for Health Improvement and Disparities, Infant Feeding Survey in England 2024: summary of main findings)
- In the US Infant Feeding Practices Study II (2005–2007), about 60% of 1,177 mothers who stopped breastfeeding did so earlier than they had wanted. (Source: Odom EC et al., ‘Reasons for Earlier Than Desired Cessation of Breastfeeding’, Pediatrics 2013 (PMC full text), 2007)
- In the US Infant Feeding Practices Study II (2005–2007), 57.8% of mothers who stopped breastfeeding earlier than desired rated not having enough milk as an important reason, compared with 29.9% of those who met their goal. (Source: Odom EC et al., ‘Reasons for Earlier Than Desired Cessation of Breastfeeding’, Pediatrics 2013 (PMC full text), 2007)
- A systematic review of global studies found a pooled lactational mastitis incidence of 11.1 episodes per 1,000 breastfeeding weeks between birth and week 25 postpartum, with the highest incidence in the first four weeks. (Source: Wilson E, Woodd SL, Benova L, ‘Incidence of and Risk Factors for Lactational Mastitis: A Systematic Review’, Journal of Human Lactation 2020 (Institute of Tropical Medicine Antwerp repository PDF), 2019)
- A meta-analysis of 71 studies published in the Journal of the American Dental Association in 2022 found tongue-tie (ankyloglossia) prevalence of 7% in infants and 5% overall, ranging from 2% to 20% depending on the assessment tool used. (Source: ADA News, report on JADA meta-analysis of ankyloglossia prevalence (October 2022))
Health and economic impact
Low breastfeeding rates cost hundreds of thousands of child and maternal lives and hundreds of billions of dollars a year worldwide, while every dollar invested in breastfeeding support is estimated to return many times its cost.
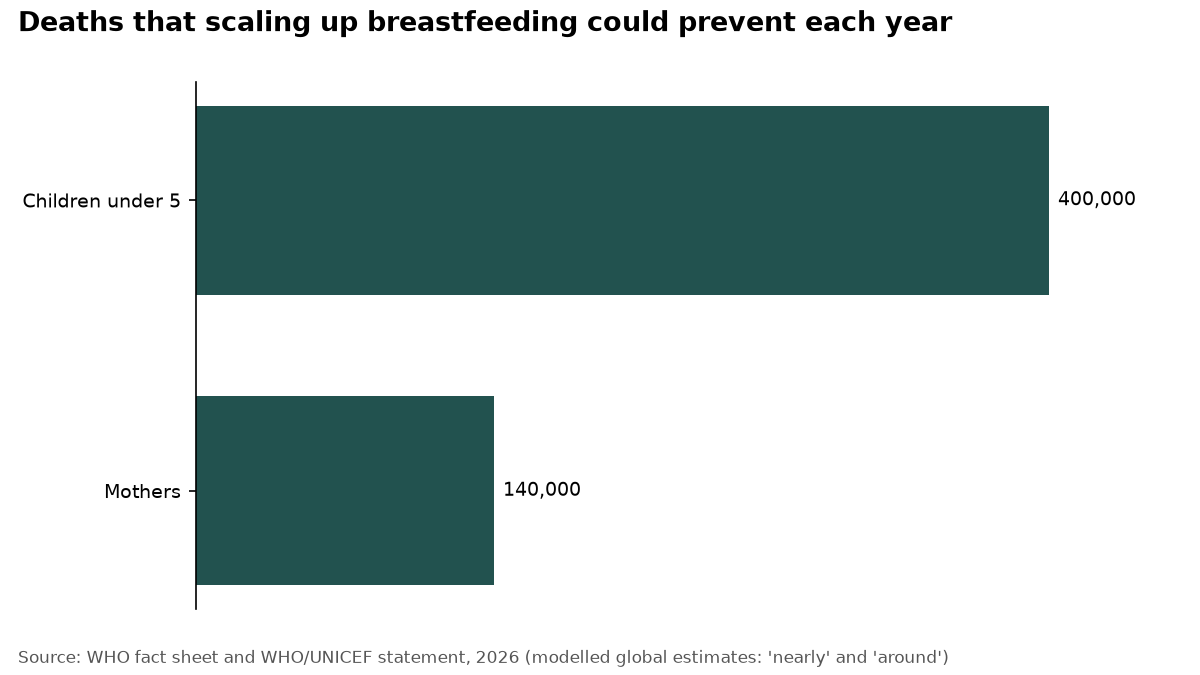 WHO estimates nearly 400,000 child and around 140,000 maternal deaths a year are preventable (WHO, 2026).
- WHO estimates that nearly 400 000 deaths of children under 5 could be prevented every year worldwide if all infants were exclusively breastfed for six months and breastfed up to two years or beyond. (Source: World Health Organization, Infant and young child feeding fact sheet, 2026)
- Scaling up breastfeeding could prevent around 140 000 maternal deaths each year worldwide, alongside almost 400 000 child deaths, according to WHO and UNICEF in July 2026. (Source: WHO/UNICEF joint statement for World Breastfeeding Week, 31 July 2026)
- Underfunding of breastfeeding programmes causes estimated global economic losses of US$ 339 billion each year, equal to 0.32% of global gross national income, according to WHO. (Source: World Health Organization, Infant and young child feeding fact sheet, 2026)
- Globally, every US$ 1 invested in breastfeeding promotion is estimated to generate US$ 59 in economic returns, through lower health-care costs, better cognitive development, higher educational attainment and higher lifetime earnings, according to WHO and UNICEF in 2026. (Source: WHO/UNICEF joint statement for World Breastfeeding Week, 31 July 2026 (Global Investment Case for Improved Breastfeeding))
- A 2019 global modelling study estimated that 595 379 deaths a year among children aged 6 to 59 months from diarrhoea and pneumonia can be attributed to not breastfeeding. (Source: Walters, Phan & Mathisen, ‘The cost of not breastfeeding: global results from a new tool’, Health Policy and Planning, 2019, 2017)
- In the United States, suboptimal breastfeeding was estimated to cause 3,340 excess deaths a year, 78% of them among mothers, comparing 2012 breastfeeding rates with a scenario in which 90% of infants were breastfed as medically recommended. (Source: Bartick et al., ‘Suboptimal breastfeeding in the United States: Maternal and pediatric health outcomes and costs’, Maternal & Child Nutrition, 2017 (PMC6866210), 2012)
- A 2025 National Academies committee concluded that existing evidence points to annual US national losses from suboptimal breastfeeding of between $17 billion and over $100 billion. (Source: National Academies of Sciences, Engineering, and Medicine, Breastfeeding in the United States: Strategies to Support Families and Achieve National Goals (2025), Chapter 2, Conclusion 2-2, 2024)
- An AHRQ-commissioned systematic review (Patnode et al., 2025, literature to August 2024) found an approximately 33% reduced risk of ear infections (otitis media) in children who were ever breastfed versus never breastfed, as summarised by the National Academies. (Source: National Academies of Sciences, Engineering, and Medicine, Breastfeeding in the United States (2025), Chapter 2, Table 2-1 (summarising Patnode et al., Pediatrics 2025), 2024)
Donor milk, formula and milk sharing
Nonprofit donor milk banks in North America dispensed a record 13 million ounces in 2025, while the 2022 US formula shortage showed how much families depend on a highly concentrated, WIC-dominated formula market.
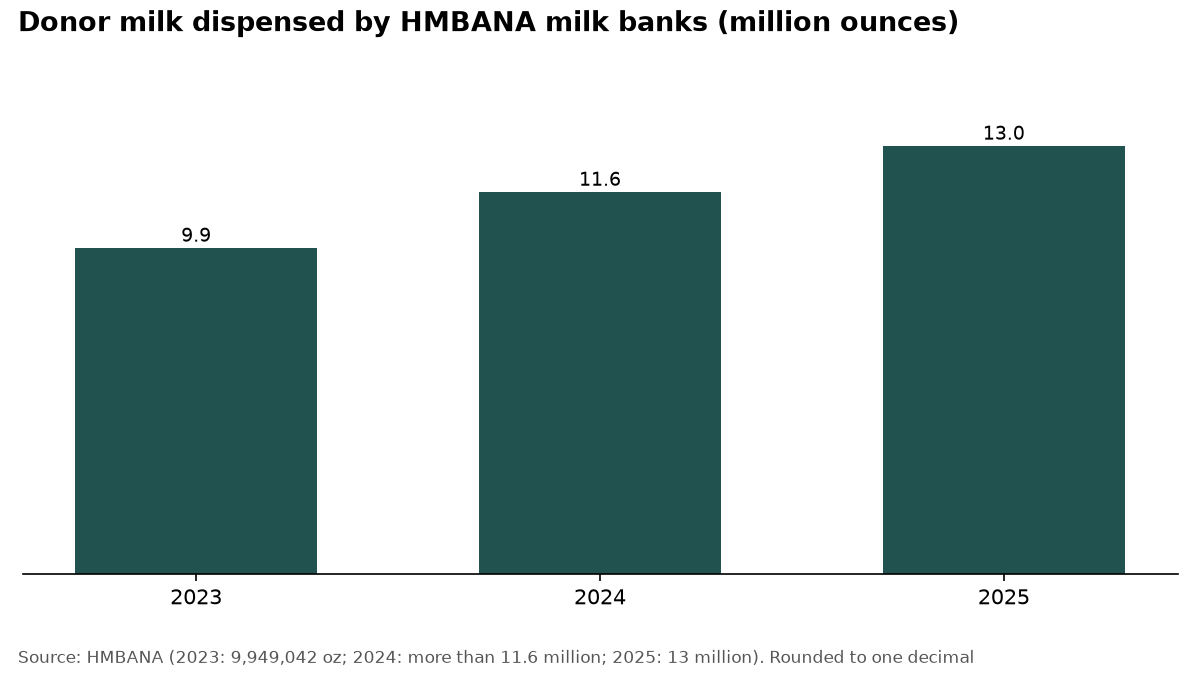 Nonprofit donor milk dispensed rose by about 3 million ounces in two years (HMBANA).
- The nonprofit member milk banks of the Human Milk Banking Association of North America (HMBANA) dispensed a record 13 million ounces of pasteurized donor human milk in 2025, 12% more than in 2024. (Source: HMBANA press release, 5 February 2026, 2025)
- HMBANA had 31 member nonprofit milk banks in North America as of February 2026, all operating under the association’s safety and clinical standards. (Source: HMBANA press release, 5 February 2026)
- HMBANA milk banks dispensed more than 11.6 million ounces of donor milk in 2024, and nearly one quarter of that volume went to outpatients as surplus milk rather than to hospitals. (Source: HMBANA, updated statement on milk supply for small, vulnerable newborns (22 September 2025), 2024)
- In 2023, HMBANA member milk banks distributed a total of 9,949,042 ounces of donor human milk, serving 1500 hospitals. (Source: HMBANA press release, 8 February 2024, 2023)
- In a US study of 1,909 first-time mothers who intended to breastfeed (enrolled 2021–2022 in 39 states), 3.7% fed their infant informally shared human milk from friends, family or milk-sharing networks. (Source: Demirci et al., ‘Informal Human Milk Sharing Among US Mothers’, JAMA Network Open, November 2025, 2023)
- During the US infant formula shortage, 34.7% of households with babies under 1 reported difficulty obtaining infant formula in the past seven days in fall 2022 (Sept. 14–Oct. 17), falling to 19.8% by summer 2023. (Source: US Census Bureau, Household Pulse Survey (America Counts story, April 2024), 2023)
- In summer 2023, 32.6% of US households with infants reported getting formula from friends, family or others as a way of coping with formula supply problems. (Source: US Census Bureau, Household Pulse Survey (America Counts story, April 2024), 2023)
- Infants in USDA’s WIC program consumed an estimated 56 percent of all infant formula used in the United States in 2018, down slightly from 58 percent in 2005. (Source: USDA Economic Research Service, Chart of Note (23 May 2022), 2018)
- Three manufacturers accounted for 83 percent of US infant formula sales in 2022, compared with 99 percent in 1987. (Source: USDA Economic Research Service, Chart of Note (9 April 2024), 2022)
- Rebates paid by formula manufacturers under WIC contracts saved US states about $1.6 billion in fiscal year 2023, and as of August 2024 two manufacturers held almost all WIC infant formula contracts. (Source: US Government Accountability Office, GAO-25-106503 (January 2025), 2023)
- As of September 2022, FDA import flexibilities during the US formula shortage covered imported or planned imports estimated by companies at 403 million 8 oz. bottles (18.9 million cans) of infant formula. (Source: FDA, Infant Formula Supply infographic (September 2022))
Mental health after birth
Roughly 1 in 8 US mothers report depressive symptoms after birth, symptoms are more common among those who breastfeed for less than 8 weeks, and the national maternal mental health hotline answered more than 9 in 10 contacts in 2025.
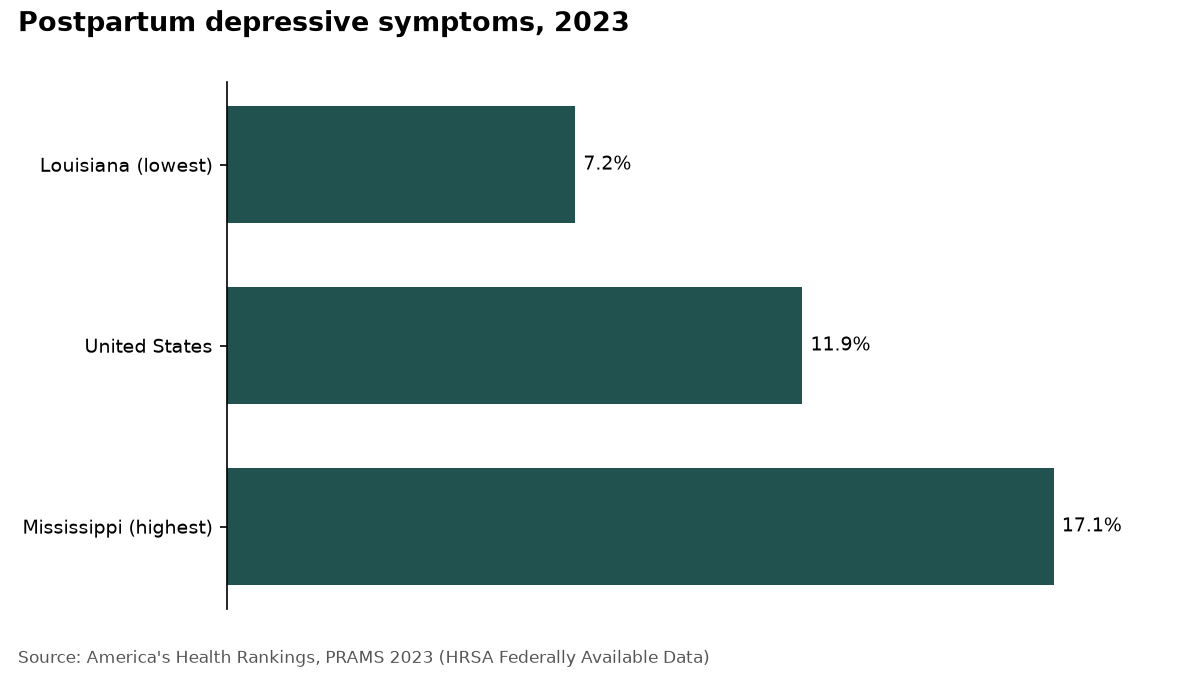 About 1 in 8 US mothers reported postpartum depressive symptoms in 2023, with a wide range by state (AHR/PRAMS).
- In 2023, 11.9% of US women with a recent live birth reported postpartum depressive symptoms, according to PRAMS data compiled by America’s Health Rankings. (Source: America’s Health Rankings (United Health Foundation), Postpartum Depression measure; data: CDC PRAMS 2023 via HRSA MCHB Federally Available Data)
- Among states reporting 2023 PRAMS data, postpartum depressive symptoms ranged from 7.2% of recent mothers in Louisiana to 17.1% in Mississippi. (Source: America’s Health Rankings (United Health Foundation), Postpartum Depression measure; data: CDC PRAMS 2023)
- The National Maternal Mental Health Hotline (1-833-TLC-MAMA) received 33,720 calls and texts in federal fiscal year 2025 (October 2024 to September 2025), about 65 percent of them calls. (Source: US Government Accountability Office, GAO-26-109046, HHS and VA Hotlines briefing (2026), 2025)
- Monthly answer rates for calls and texts to the National Maternal Mental Health Hotline stayed between 92 and 95 percent throughout fiscal year 2025, GAO found. (Source: US Government Accountability Office, GAO-26-109046, HHS and VA Hotlines briefing (2026), 2025)
- Among Kaiser Permanente Southern California patients, the share of pregnancies followed by a postpartum depression diagnosis doubled from 9.4% in 2010 to 19.0% in 2021, based on 442,308 pregnancies. (Source: Trends in Postpartum Depression by Race, Ethnicity, and Prepregnancy Body Mass Index. JAMA Network Open, November 2024 (Kaiser Permanente Southern California), 2021)
- A 2023 meta-analysis of nine studies using the Edinburgh Postnatal Depression Scale found that women with postpartum depression had 2.25 times the odds of not breastfeeding exclusively compared with women without it. (Source: Breastfeeding in Women with Postpartum Depression: A Systematic Review and Meta-Analysis. Ethiopian Journal of Health Sciences, 2023)
- In 2018 PRAMS data from 31 US sites, 87.4% of women with a recent live birth said a health care provider asked them about depression at their postpartum checkup, but the share fell to 50.7% in Puerto Rico. (Source: Bauman BL, Ko JY, Cox S, et al. Vital Signs: Postpartum Depressive Symptoms and Provider Discussions About Perinatal Depression - United States, 2018. MMWR 2020;69(19):575-581 (PMC full text))
- In 2018 PRAMS data, 15.6% of US mothers who breastfed for less than 8 weeks reported postpartum depressive symptoms, compared with 11.8% of those who breastfed for 8 weeks or longer. (Source: Bauman BL, Ko JY, Cox S, et al. Vital Signs: Postpartum Depressive Symptoms and Provider Discussions About Perinatal Depression - United States, 2018. MMWR 2020;69(19):575-581 (PMC full text))
Methodology
We included only figures we could read on the publisher’s own page: government statistics agencies and health departments (CDC, USDA, BLS, Census Bureau, HRSA data, GAO, FDA, DOL, WHO, UNICEF, national statistics offices), peer-reviewed studies and reports from the organisations that collected the data (for example HMBANA, IBLCE, SHRM and Baby-Friendly USA). Search-engine snippets were never used as sources. Each stat records the number exactly as printed on the source page; a script then fetched every URL and confirmed the number is on the page, and each sentence was read against the source wording for population, unit, place and year. 25 stats sit on pages that block automated requests or are PDFs; we opened those pages directly (or extracted the PDF text) and confirmed each figure by hand, and say so in the data file. Figures marked as our calculation are derived from the cited numbers. The year shown for each stat is the year the data describes (for example 2023 for babies born in 2023), not the publication year; for modelled global estimates without a stated base year, we use the year the estimate was published. Because national breastfeeding surveys are published two to three years after the births they describe, we treat data from 2023 onward as current for this page (a three-year window rather than our usual two years). To keep the sourcing broad, no single website accounts for more than 12% of the stats. Where sources use different measures (for example breastfeeding at hospital discharge versus ever breastfed, or BLS’s 2026 change from paid family leave to paid family and medical leave), the sentence names the measure and the figures should not be compared directly. This page is general information, not medical advice. We review it every quarter and whenever a major source publishes new data.
Sources
- aap.org: American Academy of Pediatrics news release on Seoane Estruel L, Andreyeva T, ‘Breastfeeding Trends Following the US Infant Formula Shortage’, Pediatrics, January 2025
- abs.gov.au: Australian Bureau of Statistics, Breastfeeding, 2022 (National Health Survey)
- academic.oup.com: Walters, Phan & Mathisen, ‘The cost of not breastfeeding: global results from a new tool’, Health Policy and Planning, 2019
- adanews.ada.org: ADA News, report on JADA meta-analysis of ankyloglossia prevalence (October 2022)
- americashealthrankings.org: America’s Health Rankings (United Health Foundation), Breastfeeding Initiation: American Indian/Alaska Native; data: CDC NCHS natality files via CDC WONDER, 2024; America’s Health Rankings (United Health Foundation), Breastfeeding Initiation: Asian; data: CDC NCHS natality files via CDC WONDER, 2024; America’s Health Rankings (United Health Foundation), Breastfeeding Initiation: Black, state table; data: CDC WONDER natality, 2024; America’s Health Rankings (United Health Foundation), Breastfeeding Initiation: Black; data: CDC NCHS natality files via CDC WONDER, 2024; America’s Health Rankings (United Health Foundation), Breastfeeding Initiation; data: CDC NCHS natality files via CDC WONDER, 2024; America’s Health Rankings (United Health Foundation), Postpartum Depression measure; data: CDC PRAMS 2023; America’s Health Rankings (United Health Foundation), Postpartum Depression measure; data: CDC PRAMS 2023 via HRSA MCHB Federally Available Data; America’s Health Rankings (United Health Foundation), measure ‘Breastfed’, using CDC NIS-Child 2022 birth cohort
- babyfriendlyusa.org: Baby-Friendly USA, About the Baby-Friendly Hospital Initiative; Baby-Friendly USA, Find a Baby-Friendly hospital or birthing center
- bls.gov: US Bureau of Labor Statistics, Employee Benefits in the United States, March 2026 (news release, September 25, 2026); US Bureau of Labor Statistics, Employment Characteristics of Families, Table 6 (2025 annual averages); US Bureau of Labor Statistics, Family leave benefits fact sheet
- cdc.gov: CDC, Maternity Practices in Infant Nutrition and Care (mPINC) 2024 national results; CDC, National Immunization Survey-Child, Rates of Any and Exclusive Breastfeeding by Socio-demographics (children born in 2023); CDC, National Immunization Survey-Child, Results: Breastfeeding Rates (2016-2023 births); CDC, National Immunization Survey-Child, Results: Breastfeeding Rates (2023 births); CDC, Rates of Any and Exclusive Breastfeeding by State among Children Born in 2023; CDC, mPINC 2024 national results, feeding practices
- census.gov: US Census Bureau, America Counts: ‘Share of Women Who Worked Before Their First Birth Rose’ (May 13, 2025), SIPP 2022; US Census Bureau, Household Pulse Survey (America Counts story, April 2024)
- dhs.wisconsin.gov: Wisconsin Department of Health Services, WIC Infant Breastfeeding and Fully Formula Fed Rates (2018-2024)
- dol.gov: US Department of Labor, Wage and Hour Division, Fact Sheet #73 (revised December 2025)
- ers.usda.gov: USDA Economic Research Service, Chart of Note (23 May 2022); USDA Economic Research Service, Chart of Note (9 April 2024); USDA Economic Research Service, Charts of Note: Breastfeeding in WIC program continued to increase in fiscal year 2024 (April 2025)
- ethjhealths.org: Breastfeeding in Women with Postpartum Depression: A Systematic Review and Meta-Analysis. Ethiopian Journal of Health Sciences, 2023
- fda.gov: FDA, Infant Formula Supply infographic (September 2022)
- fns.usda.gov: USDA Food and Nutrition Service, Fiscal Year 2023 WIC Breastfeeding Data Local Agency Report (published October 2024); USDA Food and Nutrition Service, WIC Participant and Program Characteristics 2022
- frontiersin.org: Diaz LE, Yee LM, Feinglass J. Rates of breastfeeding initiation and duration in the United States: data insights from the 2016-2019 PRAMS. Frontiers in Public Health, 2023;11:1256432
- gao.gov: US Government Accountability Office, GAO-25-106503 (January 2025); US Government Accountability Office, GAO-26-109046, HHS and VA Hotlines briefing (2026)
- gov.uk: Office for Health Improvement and Disparities (GOV.UK), Breastfeeding at 6 to 8 weeks 2024 to 2025: statistical commentary; Office for Health Improvement and Disparities (GOV.UK), Infant feeding survey 2024: summary of main findings; Office for Health Improvement and Disparities, Infant Feeding Survey in England 2024: summary of main findings
- health-infobase.canada.ca: Public Health Agency of Canada, Canada’s breastfeeding dashboard (2024 edition), Canadian Community Health Survey data
- hmbana.org: HMBANA press release, 5 February 2026; HMBANA press release, 8 February 2024; HMBANA, updated statement on milk supply for small, vulnerable newborns (22 September 2025)
- iblce.org: IBLCE, Current Statistics on Worldwide IBCLCs (data as of January 22, 2026)
- jamanetwork.com: Demirci et al., ‘Informal Human Milk Sharing Among US Mothers’, JAMA Network Open, November 2025; Li R et al., ‘Breastfeeding Trends by Race/Ethnicity Among US Children Born From 2009 to 2015’, JAMA Pediatrics, 2019; Trends in Postpartum Depression by Race, Ethnicity, and Prepregnancy Body Mass Index. JAMA Network Open, November 2024 (Kaiser Permanente Southern California)
- journals.plos.org: Grubesic T, et al. Spatial inequalities in breastfeeding initiation in the United States: a multiscale analysis of county-level determinants. PLOS Global Public Health, 2026
- nationalacademies.org: National Academies of Sciences, Engineering, and Medicine, Breastfeeding in the United States (2025), Chapter 2, Table 2-1 (summarising Patnode et al., Pediatrics 2025); National Academies of Sciences, Engineering, and Medicine, Breastfeeding in the United States: Strategies to Support Families and Achieve National Goals (2025), Chapter 2, Conclusion 2-2
- odphp.health.gov: Healthy People 2030 (ODPHP), objective MICH-15; Healthy People 2030 (ODPHP), objective MICH-16
- pmc.ncbi.nlm.nih.gov: Bartick et al., ‘Suboptimal breastfeeding in the United States: Maternal and pediatric health outcomes and costs’, Maternal & Child Nutrition, 2017 (PMC6866210); Bauman BL, Ko JY, Cox S, et al. Vital Signs: Postpartum Depressive Symptoms and Provider Discussions About Perinatal Depression - United States, 2018. MMWR 2020;69(19):575-581 (PMC full text); Odom EC et al., ‘Reasons for Earlier Than Desired Cessation of Breastfeeding’, Pediatrics 2013 (PMC full text)
- publichealthscotland.scot: Public Health Scotland, Infant feeding statistics, financial year 2024 to 2025
- pure.itg.be: Wilson E, Woodd SL, Benova L, ‘Incidence of and Risk Factors for Lactational Mastitis: A Systematic Review’, Journal of Human Lactation 2020 (Institute of Tropical Medicine Antwerp repository PDF)
- shrm.org: SHRM, ‘Paid parental leave increases’ (June 17, 2026); SHRM, 2026 Employee Benefits Survey (news article, June 17, 2026); SHRM, 2026 Employee Benefits Survey, Executive Summary (PDF)
- socialstyrelsen.se: Socialstyrelsen (Swedish National Board of Health and Welfare), Statistik om amning
- unicef.org: UNICEF Bangladesh and WHO, press release on World Breastfeeding Week 2026 (Bangladesh MICS 2025)
- who.int: WHO/UNICEF joint statement for World Breastfeeding Week, 31 July 2026; WHO/UNICEF joint statement for World Breastfeeding Week, 31 July 2026 (Global Investment Case for Improved Breastfeeding); World Health Organization, Infant and young child feeding fact sheet